
Nisha Patel
Problem
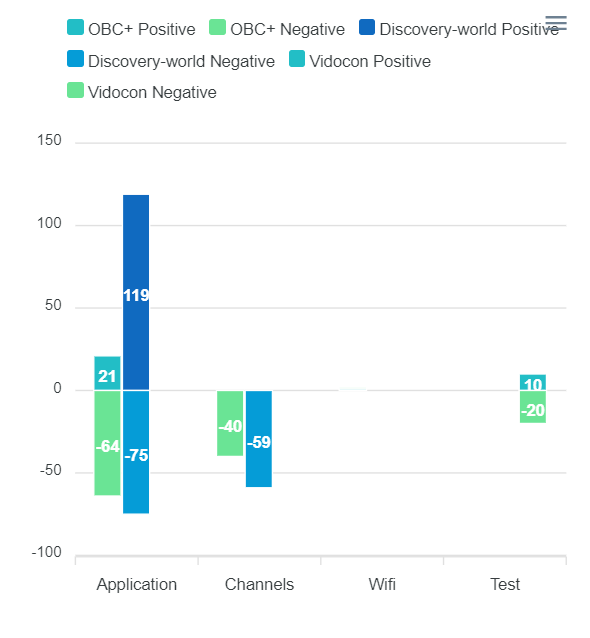
I am using the Apex stacked bar chart in my Angular 16 application. Here I have 4 categories in the x-axis, and the bar is not coming in the proper x-axis label.
My API response data:
Please check the above image. The API response here tenantName: 'Vidocon', the series data is not coming in the proper x-axis label.
It is supposed to show in the 'Test' x-axis label but it is shown in the 'Application' x-axis label.
Solution
For each bar, the data array should contain the values with the size based on your x-axis category.
Split the data with the positiveTotal and negativeTotal fields to two different objects.
Get the categoryGroups which is an array of name values from the newData. Example: "OBC+ Positive", "OBC+ Negative", "Discovery-world Positive" and etc.
Form the subLabels array by iterating the categoryGroups array and form the object with the data based on the above concept.
Suggested blogs:
>How to make the dropdown for this button ADA accessible in Angular?
>How to update properties value with event in template Angular?
>Unit Test Angular Standalone Component, Overriding Provider not used
>How to Import componet's own module using Angular?
>Why component does not display variable of another component in Angular?
>What are the ways to pass parameters to Angular service?
>How to access variables in a function using Angular?
>How can I close a bootstrap modal using Angular?
>Fix: Strange compilation error with Typescript and Angular
>Uploading files and JSON data in the same request with Angular
>CRUD Operations In ASP.NET Core Using Entity Framework Core Code First with Angularjs
>A Complete Guide To Angular Routing